This post does two things:
- Reproduces my R-Bloggers post on the StatsBlogs website, to discover how many StatsBlogs blogs there are really.
- Considers how to interpret changes in diversity without knowingly observing births/deaths of blogs.
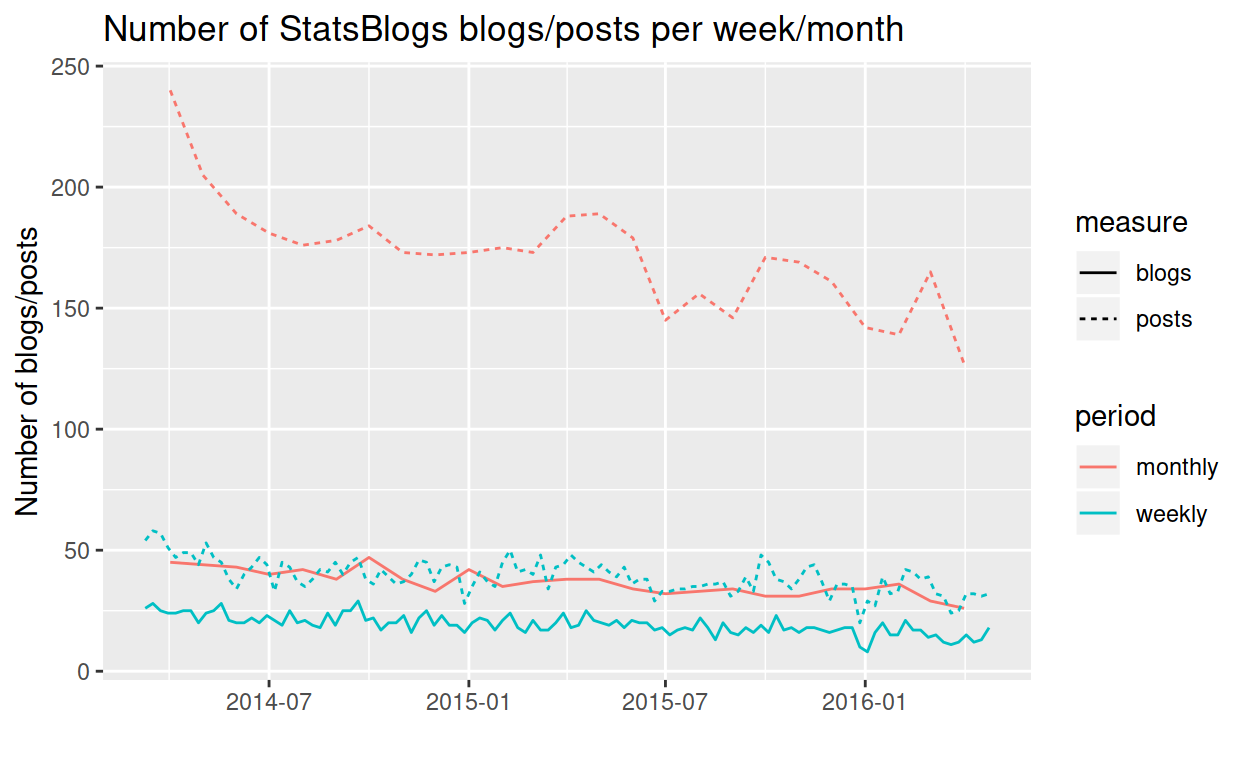
Many people who blog about statistics syndicate their posts on the the StatsBlogs website by the Talk Stats forum. The list of “contributing blogs” tends only to lengthen, but how many actual posts are there in a given week/month, from how many different blogs?
The gist of it
I subscribed to the StatsBlogs daily digest emails in February 2014, giving me a good time-series of posts. See my }}">R-Bloggers post and the code at the end of this post for how I mined the emails for names and dates.
The trends
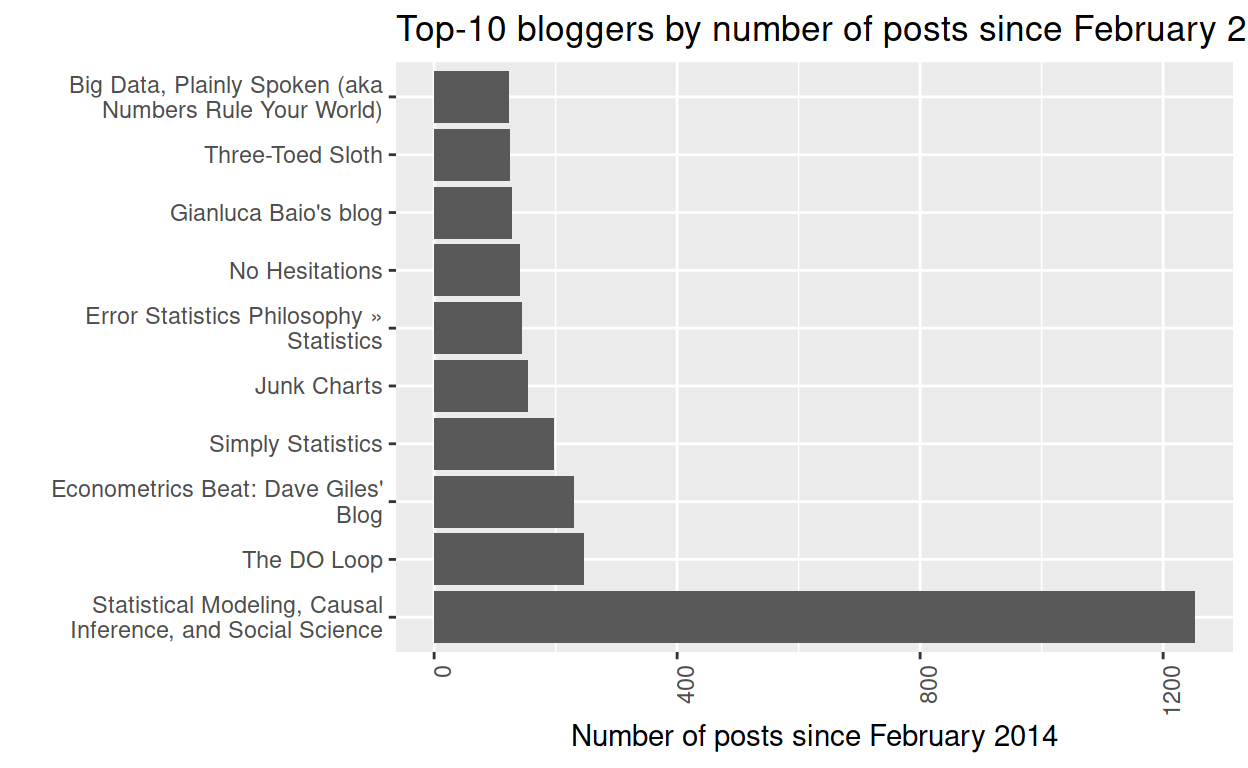
It turns out that there are have been about 30 blogs active in a given month, posting about 150 posts (the only one that regularly posts more than once per week is, no prizes for guessing, Statistical Modeling, Causal Inference, and Social Science). There was a change in mid-2015, either a step-change down from ~175 blogs/month, or the start of a decline. It’s hard to say which. When I first subscribed in February 2014, there were over 200 posts per month. Please comment if you can suggest reasons for the change.
Survival modelling without birth/death observations
Can we do a survival analysis without knowingly observing births and deaths of blogs? I haven’t trawled the blogs to find their first-ever posts, and it would be hard even for an author to identify a last-ever post. Without that crucial information, I doubt a hazard function can be estimated, though I don’t know an awful lot about that kind of thing, so maybe.
But what about diversity? I think we could get somewhere even without births and deaths. Here’s the cumulative distribution of observed blogs (the number of different blogs observed), over the whole period.
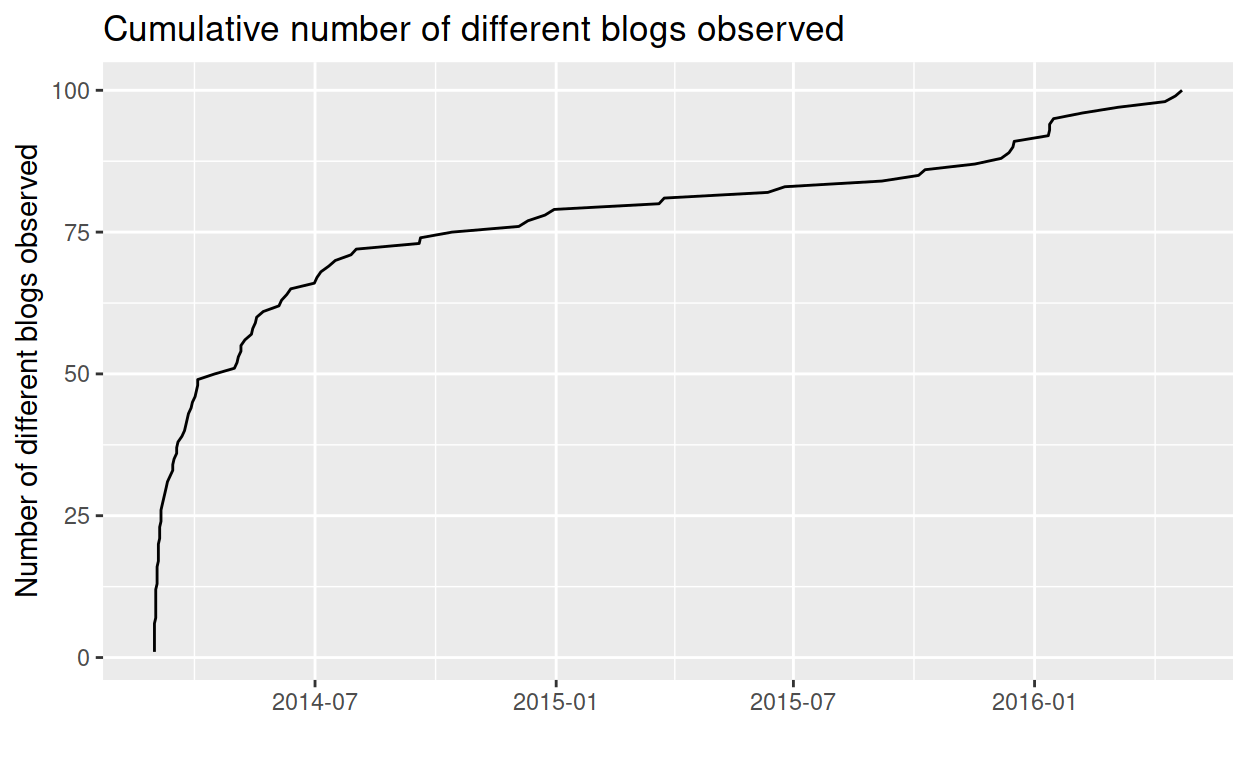
Supposing the population of blogs were static, then the first six months of the cumulative distribution curve would make sense. Lots of blogs post daily, weekly or monthly, so by the time a couple of months have gone by, many blogs have already been observed. After that, things slacken, until after about six months the curve levels off – all blogs have been observed.
Except that it doesn’t level off. It continues to rise steadily, implying that new blogs are being syndicated. On the other hand, the number of different blogs observed in a given month (first graph) is slowly declining, so some blogs must be posting less often, or ceasing altogether. Given those slopes, the composition of the population must be changing.
I’m no clever clogs, so I’m not about to develop a statistic to describe those two slopes, to figure out their distribution, or to test hypotheses. If anyone knows anything about this, please comment!
What took so long
Almost nothing, since this post re-used the code from my R-Bloggers post. All I had to do was tweak the XPath, and then take a long bath to think about cumulative distributions.
Code
Nothing postworthy, so see GitHub if you’re interested.