Explore a supermarket of food nutrition and price (renders slowly)
Duncan Garmonsway
January 7, 2019
After feasting, thoughts turn to diets. Diets mean optimisation. Optimisation requires data. For myself, I want to know:
What is the cheapest protein, fat and carbohydrate per 100g?
What is the general distribution of nutritional value?
What is the sweeter condiment: sauce or jam?
So I scraped a supermarket.
Specifically, I scraped the grocery section of the website of a major UK supermarket, and then I sat on the data for nearly two years because it’s so untidy.
Getting nutritional information in bulk
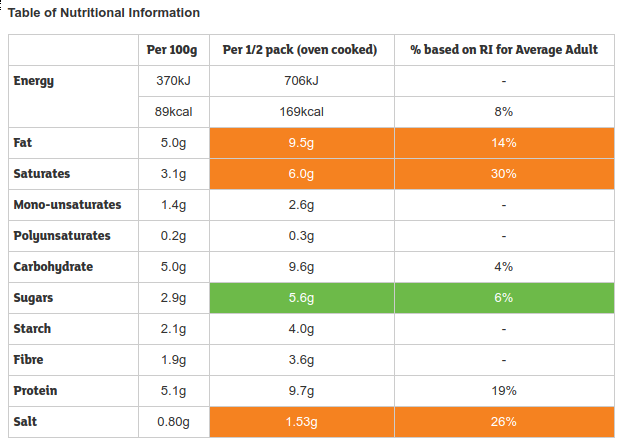
There are strict labelling requirements on food, its nutritional value in particular, so almost all food packaging gives carbohydrate, fat and protein content per 100g or 100ml. This should make it straightforward to learn about food, because the data already exists.
Table of nutritional information for Sainsbury’s Brocolli Cheese ready meal
Unfortunately, the government doesn’t collect the data, though the Office for National Statistics scraped three supermarked websites for the Consumer Price Index. I tried to do the same and regretted that the ONS hadn’t pubished its code, because it was a pain. A couple of packages have made the task tractable; htmltab is helps with spanning rows and columns html tables, my own unpivotr has improved since 2016, and reticulate makes it trivial to call the Python package quantulum3 for extracting units like grams and kilocalories from free text. The result isn’t perfectly clean data – you’ll notice some obvious glitches – but it’s good for shopping.
The cheapest food by nutritional value
The cheapest grocery overall, by mass, was own-brand diet lemonade. All the top ten were soft drinks. But what you’re buying when you buy diet pop is basically water, so it’s far from the cheapest for any kind of nutrition. The cheapest energy and cheapest carbohydrate is flour, with bread and sugar filling out the top ten (wine is probably a mistake). The cheapest fat is lard, with non-butter spread, oil, and mayonnaise (mostly oil) filling out the top ten.
The cheapest protein? Also flour. But you could splash out and get 25kg of chicken portions.
Expand the headings below to see the top 10 in each category.
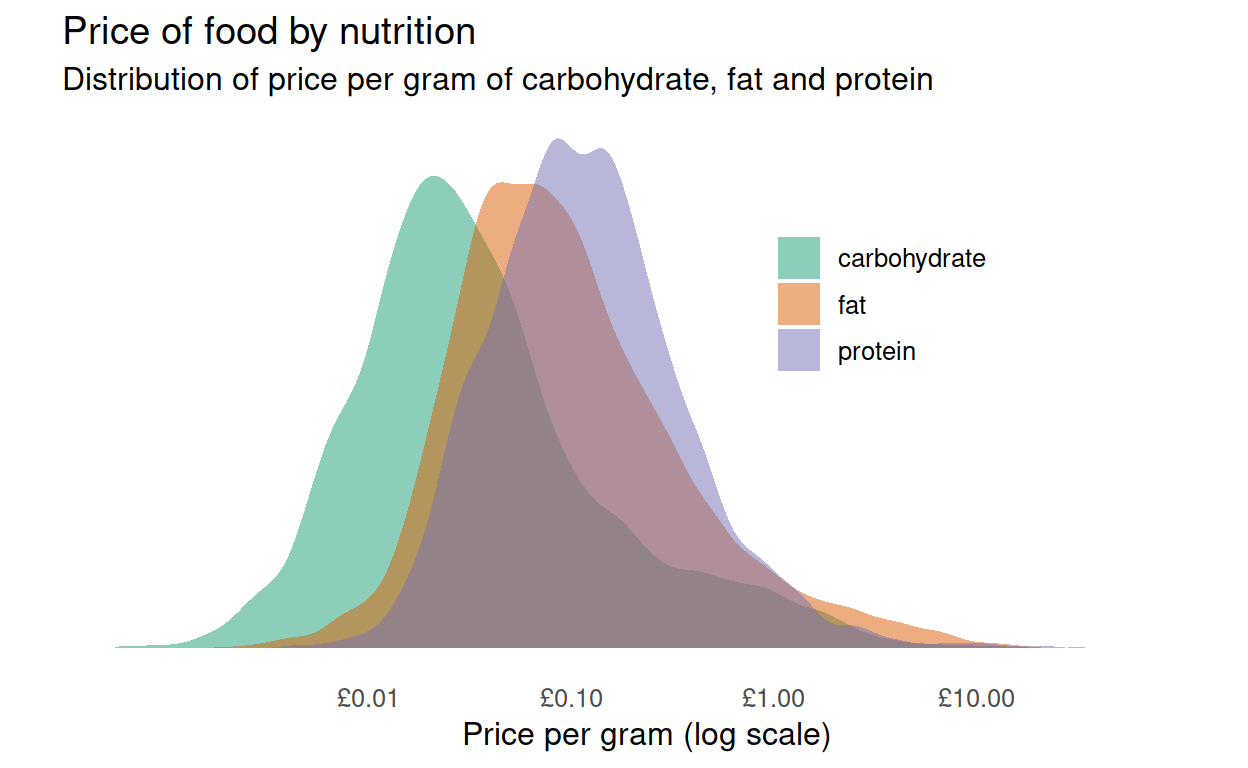
Unsurprisingly, protein is the most expensive nutritional component, then fat, then carbohydrate. But now you can tell when you’re paying over the odds. There’s a lot of choice for less than 10p per gram of protein or fat, or less than 1p per gram of carbohydrate. If you’re paying more than £1 per gram of anything then it isn’t for the nutritional value (unless it’s for something I haven’t explored, such as fibre and vitamins).
Distribution of nutritional value
You can explore an interactive 3d graph at the bottom of the post, but first I want to use ternary plots to compare particular groups of foods. A little light curation before taking the lazy option.
Ternary plots compress three-dimensional data onto two dimensions by exploiting a loophole: when the dimensions are ratios that add to 100%, there are only two degrees of freedom. Once you know the proportions of two dimensions, then you know the third. This doesn’t work for carbohydrate, fat and protein because they don’t necessarily sum to 100% of the mass of the food – diet soda drinks are 0% everything. So to make the food fit the graph, I create fake ratios: carbohydrate divided by (carbohydrate plus fat plus sugar), and so on. When reading the graphs below, a point that is near to the “carbohydrate” corner has more carbohydrate than fat or protein, but it doesn’t necessarily have much of any of them – it could be mostly water. Finally, the colour is the amount of energy, with turquoise for lots of energy and purple for not much (or missing data). Mouse over for the names of the products.
You might wonder about a data glitch in that plot. Why do there seem to be so many foods that despite having proportions of carbohydrate don’t have much energy? That’s because the purple foods on the right are comparitively high in water content – meat, bread, soup, cooked rice and pasta – whereas the turquoise foods on the left are more substantial – biscuits, crisps, sticky cake. Of course there is probably some missing data too.
Ternary plots are good for comparing groups of foods, and here they reveal some surprises. Crisps and biscuits are roughly equivalent, nutritionally. Some crisps are fattier, and some biscuits are more sugary, but there is a substantial overlap.
You might pay closer attention to food labelling when you compare sauces with jams. Fair enough, most of the jams are overplotted in the carbohydrate corner, but lots of sauces are terribly sugary.
‘Lite’ yoghurt is not so much less fatty as less carbohydrate-y than normal yoghurt.
Free exploration
It’s your turn to explore the data. Perhaps you’d like to check that my findings above are still valid as absolutes rather than proportions. Or perhaps you’ve resolved to bulk up and want to sort the data by protein content (egg white powder, then dried meat). The highest energy content? Peppermint extract is in sixth place, being almost 100% fat. You can filter the table, e.g. to find the lowest-sugar sugar (molasses, 94%), and click on rows (hold down shift to select a range) to filter the charts as well. Finally, select a region of the 2d graphs to filter the other graphs and the table. Be patient – the browser has a lot of data to deal with.
Corrections
If you see mistakes or want to suggest changes, please create an issue on the source repository.
Reuse
Text and figures are licensed under Creative Commons Attribution CC BY 4.0. Source code is available at https://github.com/nacnudus/duncangarmonsway, unless otherwise noted. The figures that have been reused from other sources don't fall under this license and can be recognized by a note in their caption: "Figure from ...".
Citation
For attribution, please cite this work as
Garmonsway (2019, Jan. 7). Duncan Garmonsway: Food Nutrition and Price. Retrieved from https://nacnudus.github.io/duncangarmonsway/posts/2019-01-07-food-nutrition-and-price/
BibTeX citation
@misc{garmonsway2019food,
author = {Garmonsway, Duncan},
title = {Duncan Garmonsway: Food Nutrition and Price},
url = {https://nacnudus.github.io/duncangarmonsway/posts/2019-01-07-food-nutrition-and-price/},
year = {2019}
}