Do you write perfect tidyverse pipelines first time? Then like Cédric Scherer @CedScher and Wei Yang Tham @wytham88 you probably find yourself faffing with trailing %>% when removing or commenting the final operation in a pipeline.
One way to get out of it is to append identity() or a rather cryptic {.} to the end of every pipeline.
# Experimental code
iris %>%
  group_by(Species) %>%
  summarise(Mean.Sepal.Length = mean(Sepal.Length)) %>%
  filter(Mean.Sepal.Length > 6)
# A tibble: 1 x 2
  Species   Mean.Sepal.Length
  <fct>                 <dbl>
1 virginica              6.59
# Comment out the final step
iris %>%
  group_by(Species) %>%
  summarise(Mean.Sepal.Length = mean(Sepal.Length)) %>%
  # filter(Mean.Sepal.Length > 6)
Error: <text>:6:0: unexpected end of input
4:   summarise(Mean.Sepal.Length = mean(Sepal.Length)) %>%
5:   # filter(Mean.Sepal.Length > 6)
  ^
# Oops, forgot to deal with the trailing %>%
iris %>%
  group_by(Species) %>%
  summarise(Mean.Sepal.Length = mean(Sepal.Length))
# A tibble: 3 x 2
  Species    Mean.Sepal.Length
  <fct>                  <dbl>
1 setosa                  5.01
2 versicolor              5.94
3 virginica               6.59
# Could have been avoided with identity() or {.}
iris %>%
  group_by(Species) %>%
  summarise(Mean.Sepal.Length = mean(Sepal.Length)) %>%
  # filter(Mean.Sepal.Length > 6) %>%
  identity()
# A tibble: 3 x 2
  Species    Mean.Sepal.Length
  <fct>                  <dbl>
1 setosa                  5.01
2 versicolor              5.94
3 virginica               6.59
# Adapted from @CedScherer's tweetUnfortunately identity() and {.} don’t work in ggplot2 piplines, so you have to use NULL instead.
ggplot(iris, aes(Sepal.Length, Sepal.Width)) +
  geom_point() +
  # scale_y_continuous(position = "right") +
  NULL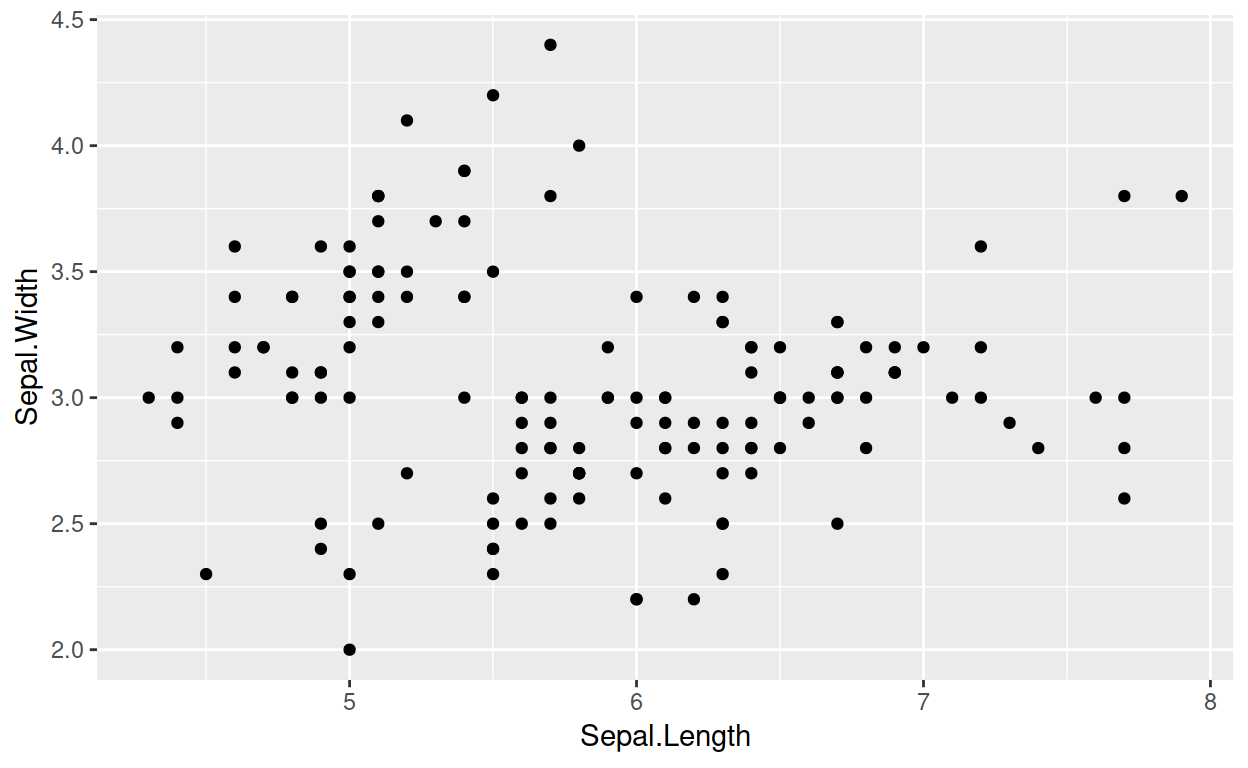
We can do better. How about a single function for both situations, with documentation and a helpful name that means “nothing” in Northern English: nowt().
nowt <- function(x = NULL) x

iris %>%
  group_by(Species) %>%
  summarise(Mean.Sepal.Length = mean(Sepal.Length)) %>%
  # filter(Mean.Sepal.Length > 6) %>%
  nowt()
# A tibble: 3 x 2
  Species    Mean.Sepal.Length
  <fct>                  <dbl>
1 setosa                  5.01
2 versicolor              5.94
3 virginica               6.59
ggplot(iris, aes(Sepal.Length, Sepal.Width)) +
  geom_point() +
  # scale_y_continuous(position = "right") +
  nowt()
Okay, so I didn’t document it because it’s in the .Rprofile rather than a packge. But if this idea were picked up by the tidyverse then it could have documentation, unlike NULL or {.}.
[Edit]
Originally nowt() took dots ... and complicated things with if (nargs()), but Hadley helpfully refactored it. Thanks Hadley!