The nzlifetables package distributes the Statistics New Zealand Cohort Life Tables spreadsheet in convenient, tidy form.
Variables
sexcohort-
ageExact age (years) -
lxNumber alive at exact age, out of 100,000 born -
LxAverage number alive in the age interval, out of 100,000 born -
dxNumber dying in the age interval, out of 100,000 born -
pxProbability that a person who reaches this age lives another year -
qxProbability that a person who reaches this age dies within a year -
mxCentral death rate for the age interval -
sxProportion of age group surviving another year -
exExpected number of years of life remaining at age x -
projectedWhether or not the statistic is a projection
Installation
# install.packages("devtools")
devtools::install_github("nacnudus/nzlifetables")
Examples
library(tidyverse)
library(nzlifetables)
theme_set(theme_minimal())
nzlifetables %>%
mutate(year = cohort + age) %>%
ggplot(aes(year, ex, colour = age,
group = interaction(age, projected),
alpha = -projected)) +
geom_line() +
scale_colour_viridis_c() +
scale_alpha(range = c(.3, 1), guide = FALSE) +
facet_wrap(~ sex) +
ggtitle("Cohort life expectancy",
sub = "Remaining lifespan, given age in a given year")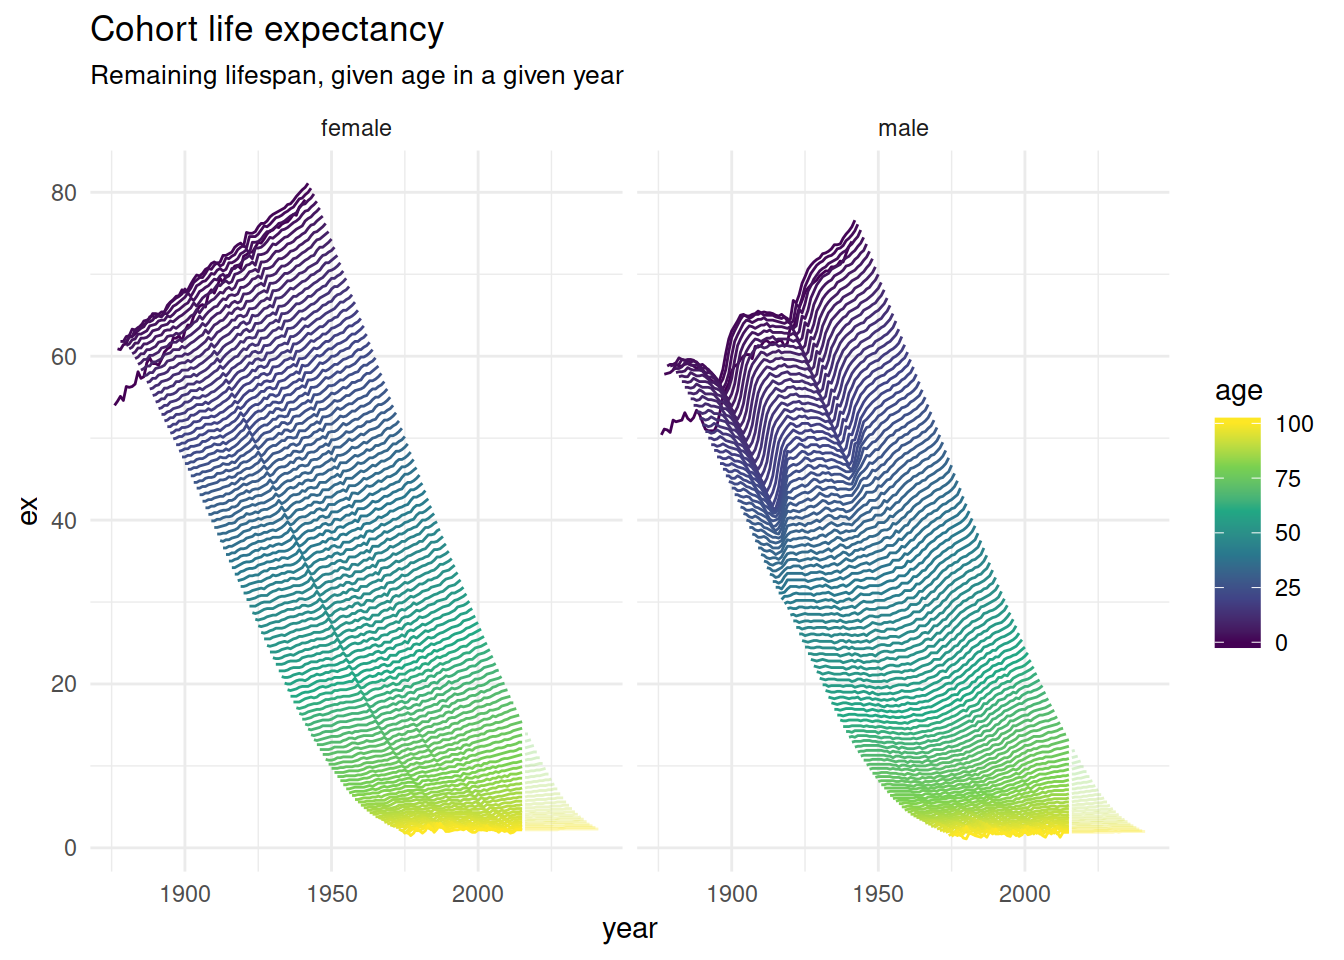
nzlifetables %>%
  mutate(year = cohort + age) %>%
  ggplot(aes(year, lx, colour = age,
             group = interaction(age, projected),
             alpha = -projected)) +
  geom_line() +
  scale_colour_viridis_c() +
  scale_alpha(range = c(.3, 1), guide = FALSE) +
  facet_wrap(~ sex) +
  ggtitle("Cohort life expectancy",
          sub = "Number alive at exact age in a given year, out of 100,000")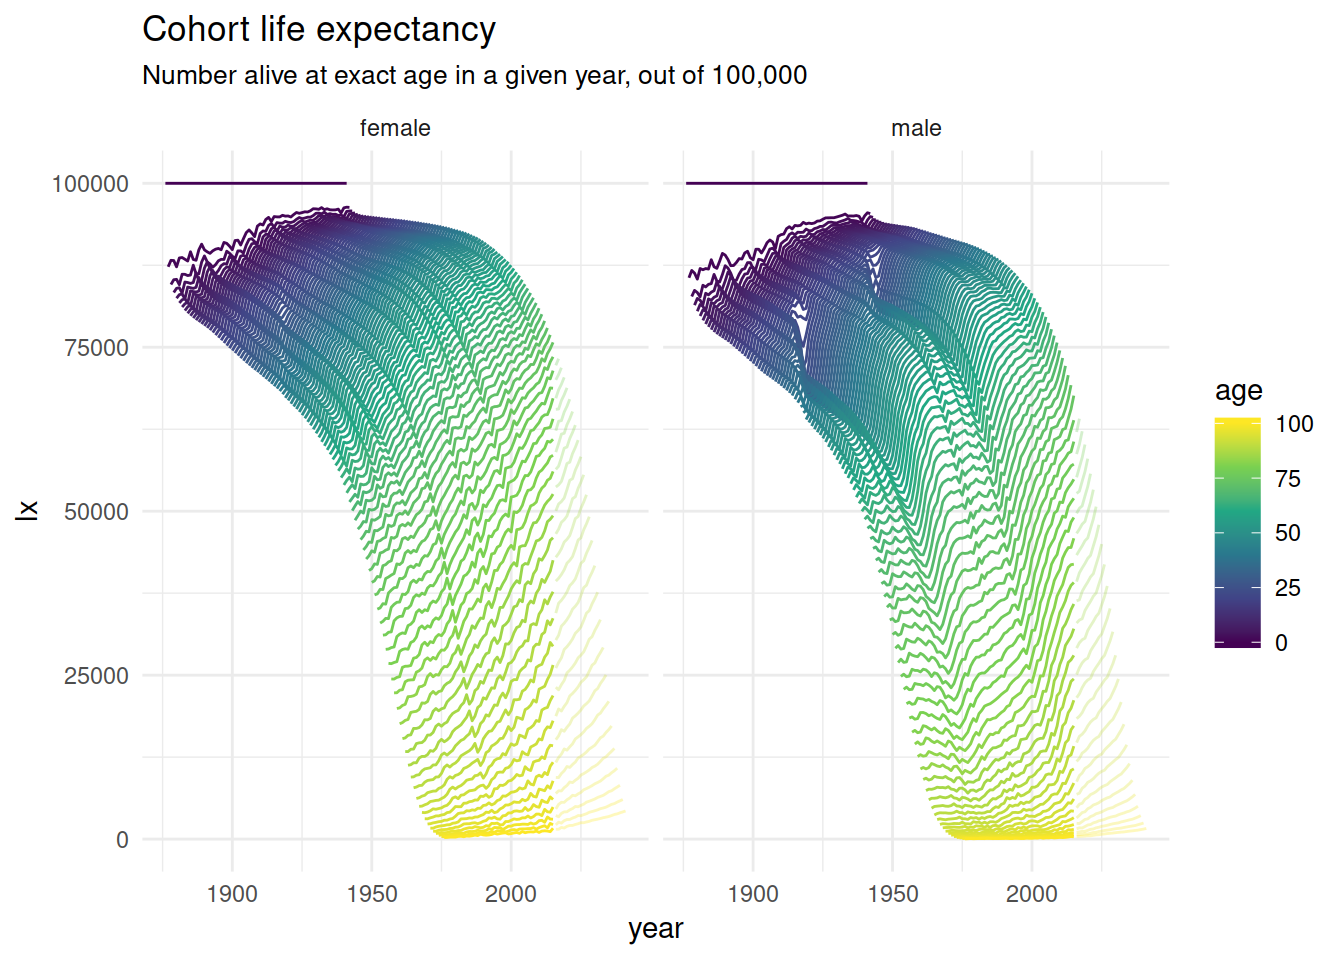
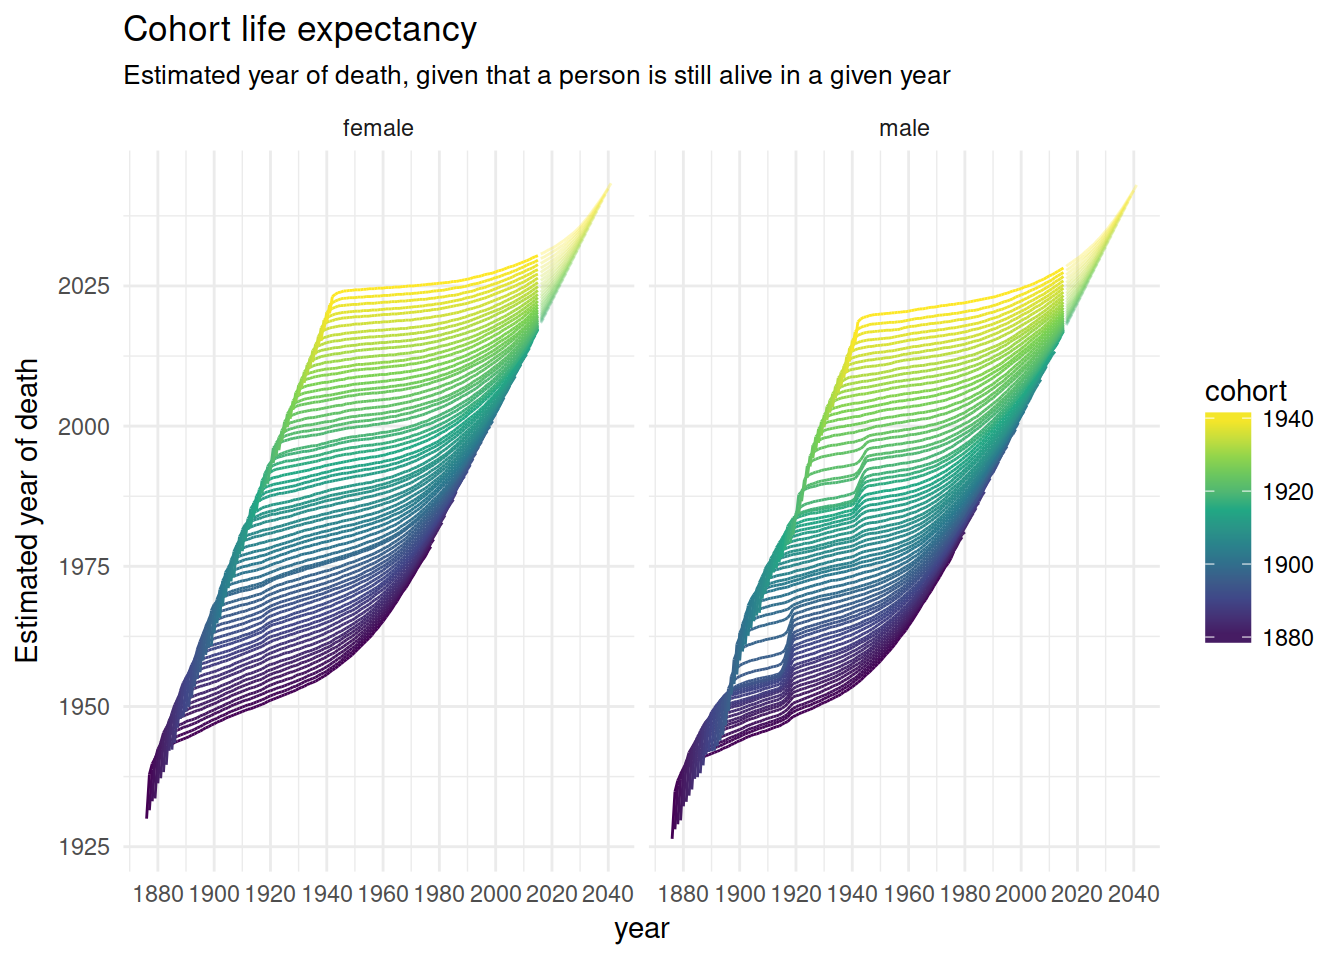
nzlifetables %>%
  mutate(year = cohort + age,
         year_of_death = year + ex) %>%
  ggplot(aes(year, year_of_death, colour = cohort,
             group = interaction(cohort, projected),
             alpha = -projected)) +
  geom_line() +
  scale_x_continuous(breaks = full_seq(c(1880, 2040), 20)) +
  scale_colour_viridis_c() +
  scale_alpha(range = c(.3, 1), guide = FALSE) +
  facet_wrap(~ sex, nrow = 1) +
  ylab("Estimated year of death") +
  ggtitle("Cohort life expectancy",
          sub = "Estimated year of death, given that a person is still alive in a given year")
nzlifetables %>%
  mutate(year = cohort + age,
         lifespan = age + ex) %>%
  ggplot(aes(year, lifespan, colour = cohort,
             group = interaction(cohort, projected),
             alpha = -projected)) +
  geom_line() +
  scale_x_continuous(breaks = full_seq(c(1880, 2040), 20)) +
  scale_colour_viridis_c() +
  scale_alpha(range = c(.3, 1), guide = FALSE) +
  facet_wrap(~ sex, nrow = 1) +
  ylab("Estimated lifespan") +
  ggtitle("Cohort life expectancy",
          sub = "Estimated lifespan, given that a person is still alive in a given year")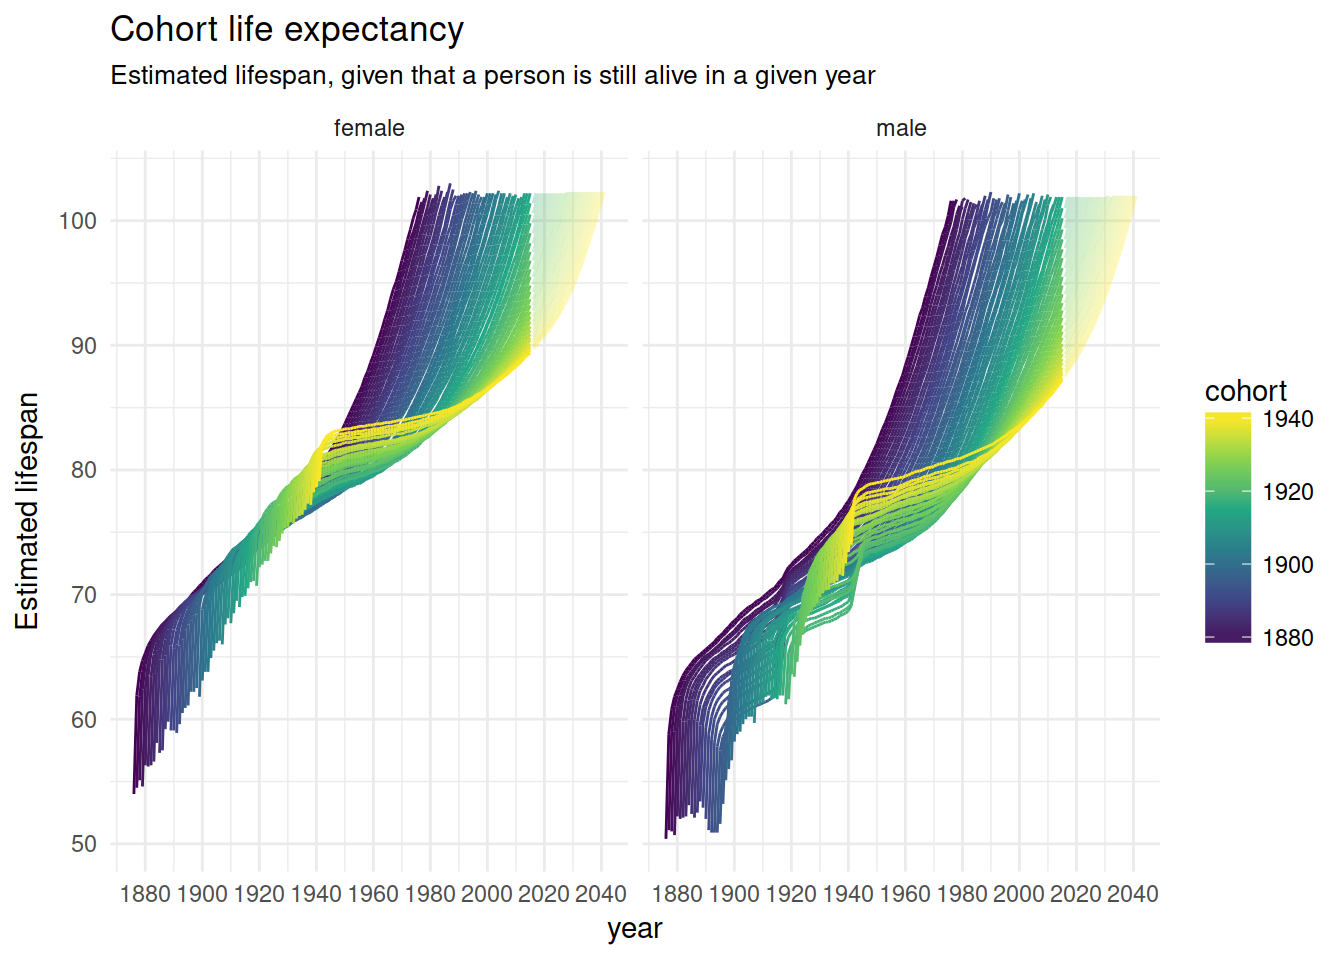
nzlifetables %>%
  mutate(lifespan = age + ex) %>%
  ggplot(aes(age, lifespan, colour = cohort,
             group = interaction(cohort, projected),
             alpha = -projected)) +
  geom_line() +
  geom_abline(intercept = 0, slope = 1) +
  scale_x_continuous(breaks = full_seq(c(0, 100), 10)) +
  scale_colour_viridis_c() +
  scale_alpha(range = c(.3, 1), guide = FALSE) +
  facet_wrap(~ sex, nrow = 1) +
  ylab("Estimated lifespan") +
  ggtitle("Cohort life expectancy",
          sub = "Estimated lifespan, given that a person is still alive at a given age")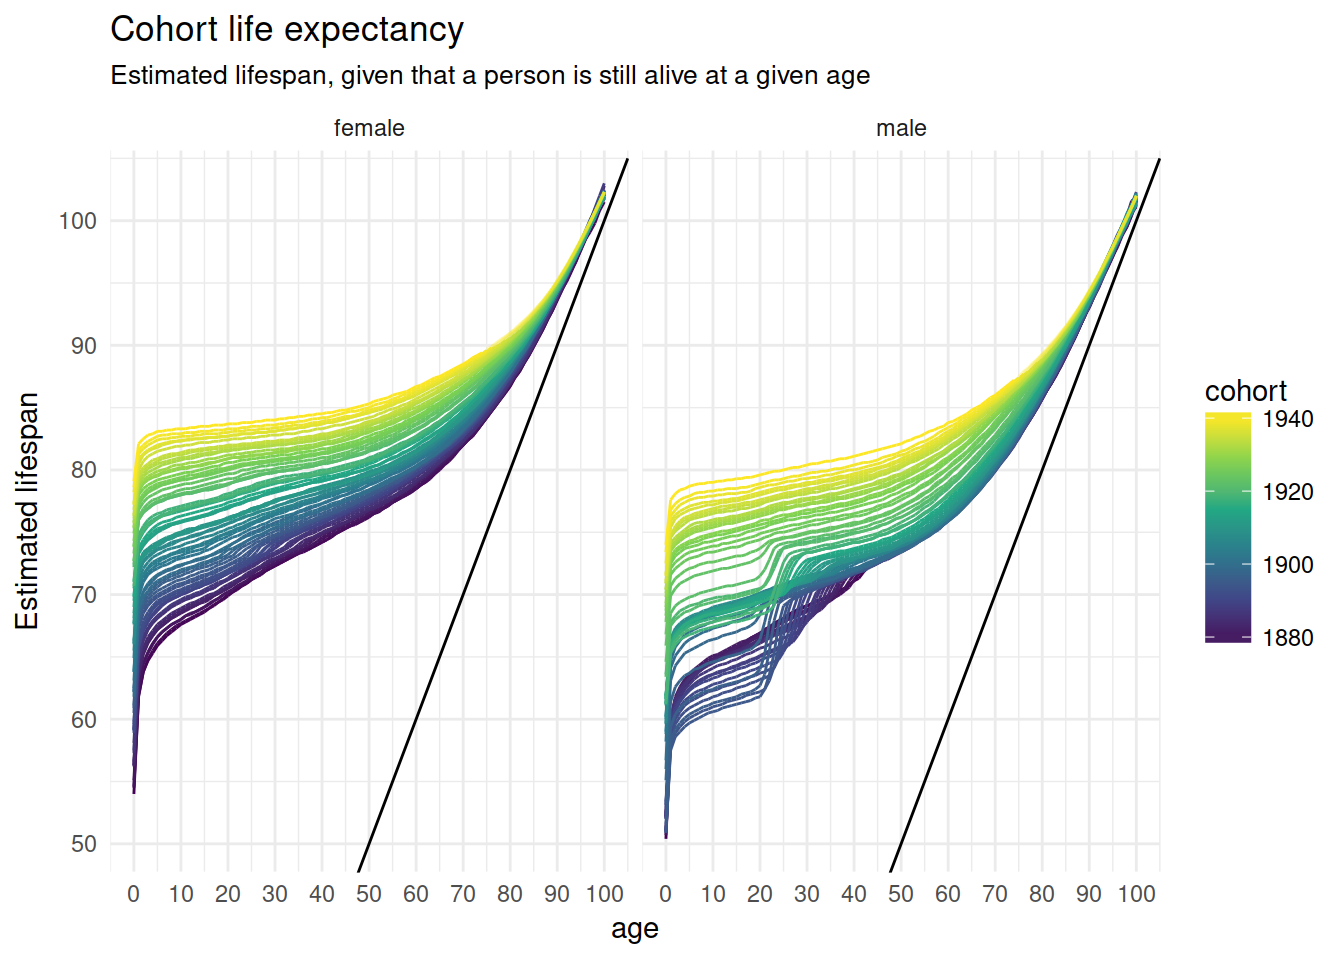
nzlifetables %>%
  ggplot(aes(age, qx, colour = cohort,
             group = interaction(cohort, projected),
             alpha = -projected)) +
  geom_line() +
  scale_x_continuous(breaks = full_seq(c(0, 100), 10)) +
  scale_colour_viridis_c() +
  scale_alpha(range = c(.3, 1), guide = FALSE) +
  facet_wrap(~ sex, nrow = 1) +
  ylab("Probabilitiy of dying with a year") +
  ggtitle("Cohort life expectancy",
          sub = "Probability of dying, given that a person is still alive at a given age")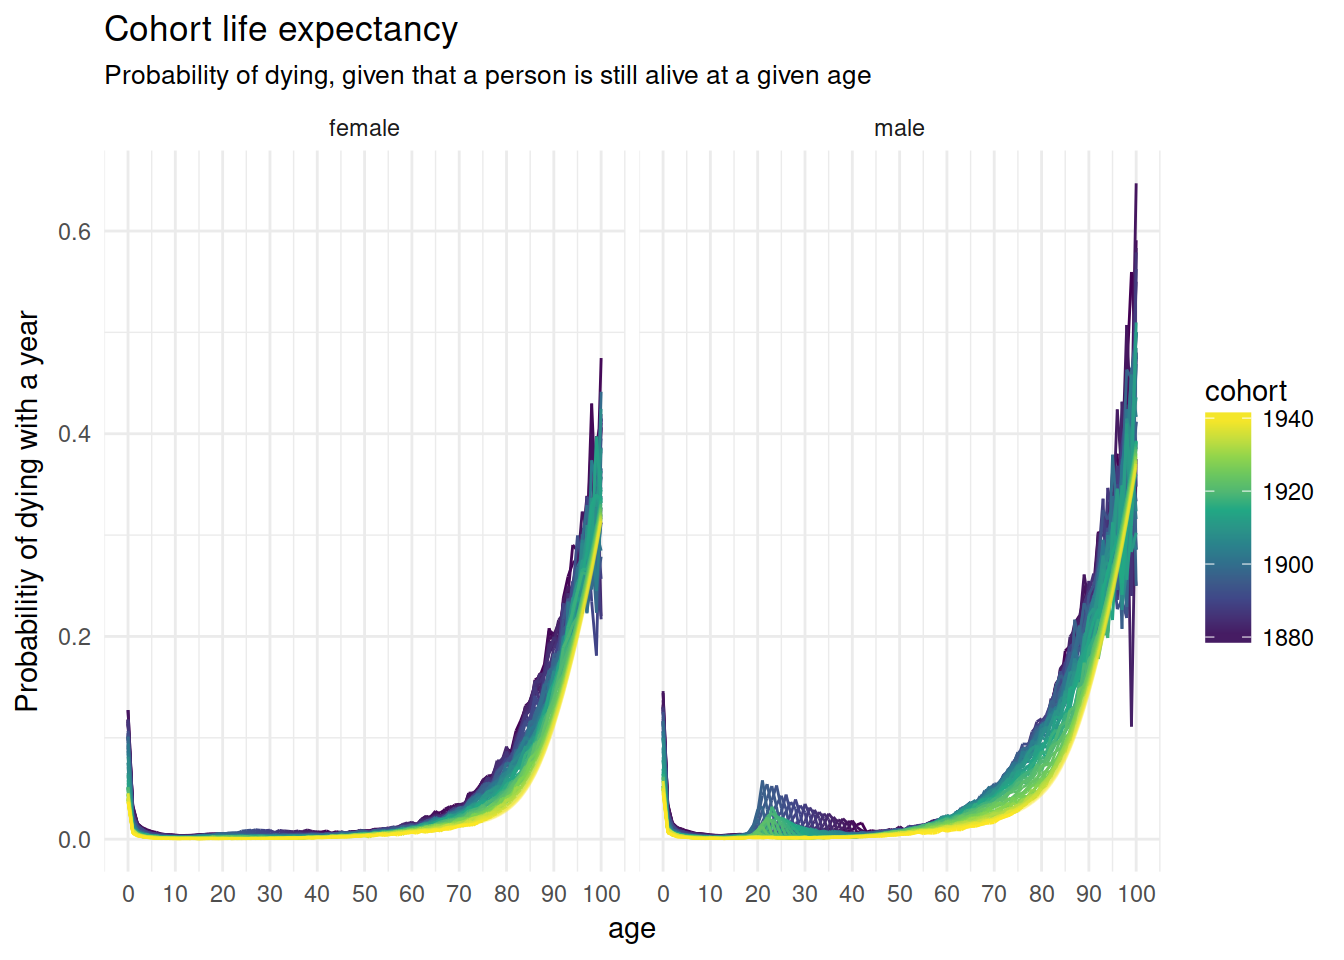
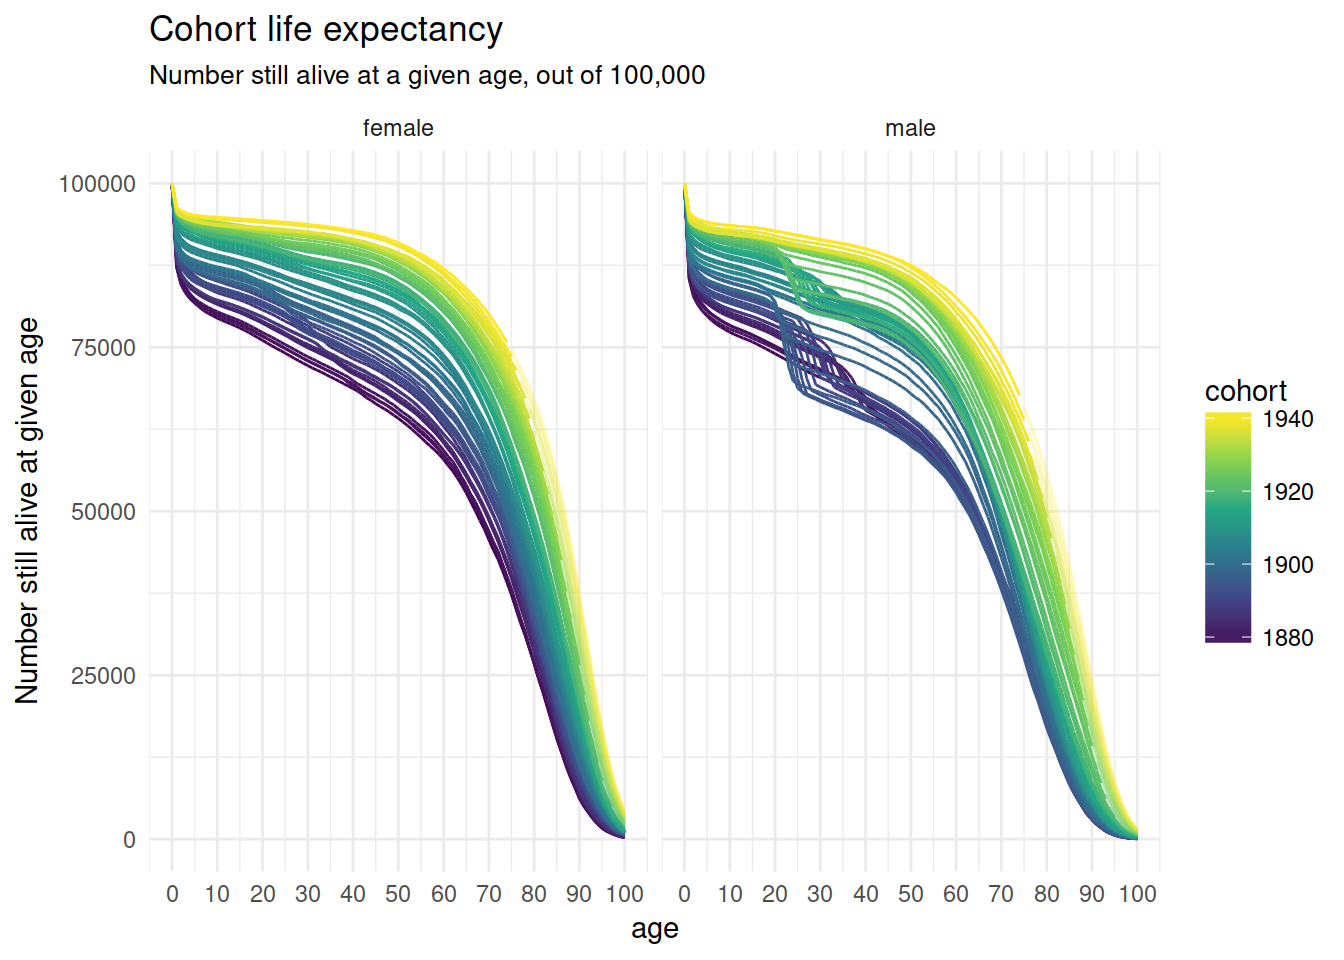
nzlifetables %>%
  ggplot(aes(age, lx, colour = cohort,
             group = interaction(cohort, projected),
             alpha = -projected)) +
  geom_line() +
  scale_x_continuous(breaks = full_seq(c(0, 100), 10)) +
  scale_colour_viridis_c() +
  scale_alpha(range = c(.3, 1), guide = FALSE) +
  facet_wrap(~ sex, nrow = 1) +
  ylab("Number still alive at given age") +
  ggtitle("Cohort life expectancy",
          sub = "Number still alive at a given age, out of 100,000")