2.2 Almost-tidy tables
For tables that are already ‘tidy’ (a single row of column headers), use packages like readxl that specialise in importing tidy data.
For everything else, read on.
2.2.1 Transposed (headers in the first row, data extends to the right)
![]()
Most packages for importing data assume that the headers are in the first row, and each row of data is an observation. They usually don’t support the alternative: headers in the first column, and each column of data is an observation.
You can hack a way around this by importing without recognising any headers,
transposing with t() (which outputs a matrix), placing the headers as names,
and converting back to a data frame, but this almost always results in all the
data types being converted.
path <- system.file("extdata", "worked-examples.xlsx", package = "unpivotr")
read_excel(path, sheet = "transposed", col_names = FALSE) %>%
  t() %>%
  `colnames<-`(.[1, ]) %>%
  .[-1, ] %>%
  as_tibble()
## New names:
## * `` -> ...1
## * `` -> ...2
## * `` -> ...3
## * `` -> ...4## # A tibble: 3 x 2
## Name Age
## <chr> <chr>
## 1 Matilda 1
## 2 Nicholas 3
## 3 Olivia 5Tidyxl and unpivotr are agnostic to the layout of tables. Importing the
transpose is the same is importing the usual layout, merely using the "left"
direction instead of "up" when beheading the headers.
xlsx_cells(path, sheet = "transposed") %>%
  behead("left", header) %>%
  select(col, data_type, header, character, numeric) %>%
  spatter(header) %>%
  select(Name, Age)
## # A tibble: 3 x 2
## Name Age
## <chr> <dbl>
## 1 Matilda 1
## 2 Nicholas 3
## 3 Olivia 52.2.2 Other stuff on the same sheet
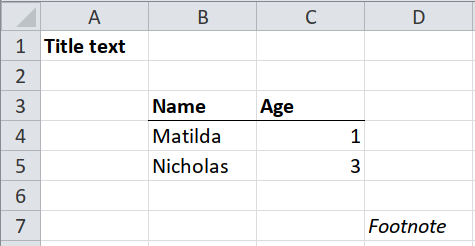
It will be more complicated when the table doesn’t begin in cell A1, or if there are non-blank cells above, below or either side of the table.
If you know at coding time which rows and columns the table occupies, then you can do the following.
- Blank or non-blank cells above the table: use the
skipargument ofreadxl::read_excel(). - Blank or non-blank cells either side of the table: use the
col_typesargument ofreadxl::read_excel()to ignore those columns. - Blank or non-blank cells below the table: use
n_maxargument ofreadxl::read_excel()to ignore those rows.
path <- system.file("extdata", "worked-examples.xlsx", package = "unpivotr")
readxl::read_excel(path,
                   sheet = "notes",
                   skip = 2,
                   n_max = 33,
                   col_types = c("guess", "guess", "skip")) %>%
  drop_na()
## # A tibble: 2 x 2
## Name Age
## <chr> <dbl>
## 1 Matilda 1
## 2 Nicholas 3If you don’t know at coding time which rows and columns the table occupies (e.g.
when the latest version of the spreadsheet is published and the table has
moved), then one strategy is to read the spreadsheet with tidyxl::xlsx_cells()
first, and inspect the results to determine the boundaries of the table. Then
use those boundaries as the skip, n_max and col_types arguments to
readxl::read_excel()
- Read the spreadsheet with
tidyxl::xlsx_cells(). Filter the result for sentinel values, e.g. the cells containing the first and final column headers, and a cell in the final row of data. - Construct the arguments
skip,n_maxandcol_typesso thatreadxl::read_excel()gets the exact dimensions of the table.
# Step 1: read the spreadsheet and filter for sentinel values to detect the
# top-left and bottom-right cells
cells <- xlsx_cells(path, sheet = "notes")
rectify(cells)
## # A tibble: 7 x 5
## `row/col` `1(A)` `2(B)` `3(C)` `4(D)`
## <int> <chr> <chr> <chr> <chr>
## 1 1 Title text <NA> <NA> <NA>
## 2 2 <NA> <NA> <NA> <NA>
## 3 3 <NA> Name Age <NA>
## 4 4 <NA> Matilda 1 <NA>
## 5 5 <NA> Nicholas 3 <NA>
## 6 6 <NA> <NA> <NA> <NA>
## 7 7 <NA> <NA> <NA> Footnote## # A tibble: 1 x 2
## row col
## <int> <int>
## 1 3 2# It can be tricky to find the bottom-right cell because you have to make some
# assumptions. Here we assume that only cells within the table are numeric.
bottom_right <-
dplyr::filter(cells, data_type == "numeric") %>%
summarise(row = max(row), col = max(col))
bottom_right## # A tibble: 1 x 2
## row col
## <int> <int>
## 1 5 3# Step 2: construct the arguments `skip` and `n_max` for read_excel()
skip <- top_left$row - 1L
n_rows <- bottom_right$row - skip
read_excel(path, sheet = "notes", skip = skip, n_max = n_rows)## # A tibble: 2 x 2
## Name Age
## <chr> <dbl>
## 1 Matilda 1
## 2 Nicholas 3Here’s another way using only tidyxl and unpivotr.
# Step 2: filter for cells between the top-left and bottom-right, and spatter
# into a table
cells %>%
  dplyr::filter(between(row, top_left$row, bottom_right$row),
         between(col, top_left$col, bottom_right$col)) %>%
  select(row, col, data_type, character, numeric) %>%
  behead("up", header) %>%
  select(-col) %>%
  spatter(header) %>%
  select(-row)
## # A tibble: 2 x 2
## Age Name
## <dbl> <chr>
## 1 1 Matilda
## 2 3 Nicholas