9.6 Cashflows

Davis Vaughan kindly blogged about using unpivotr to tidy spreadsheets of cashflows. Here is an example using unpivotr’s new, more powerful syntax.
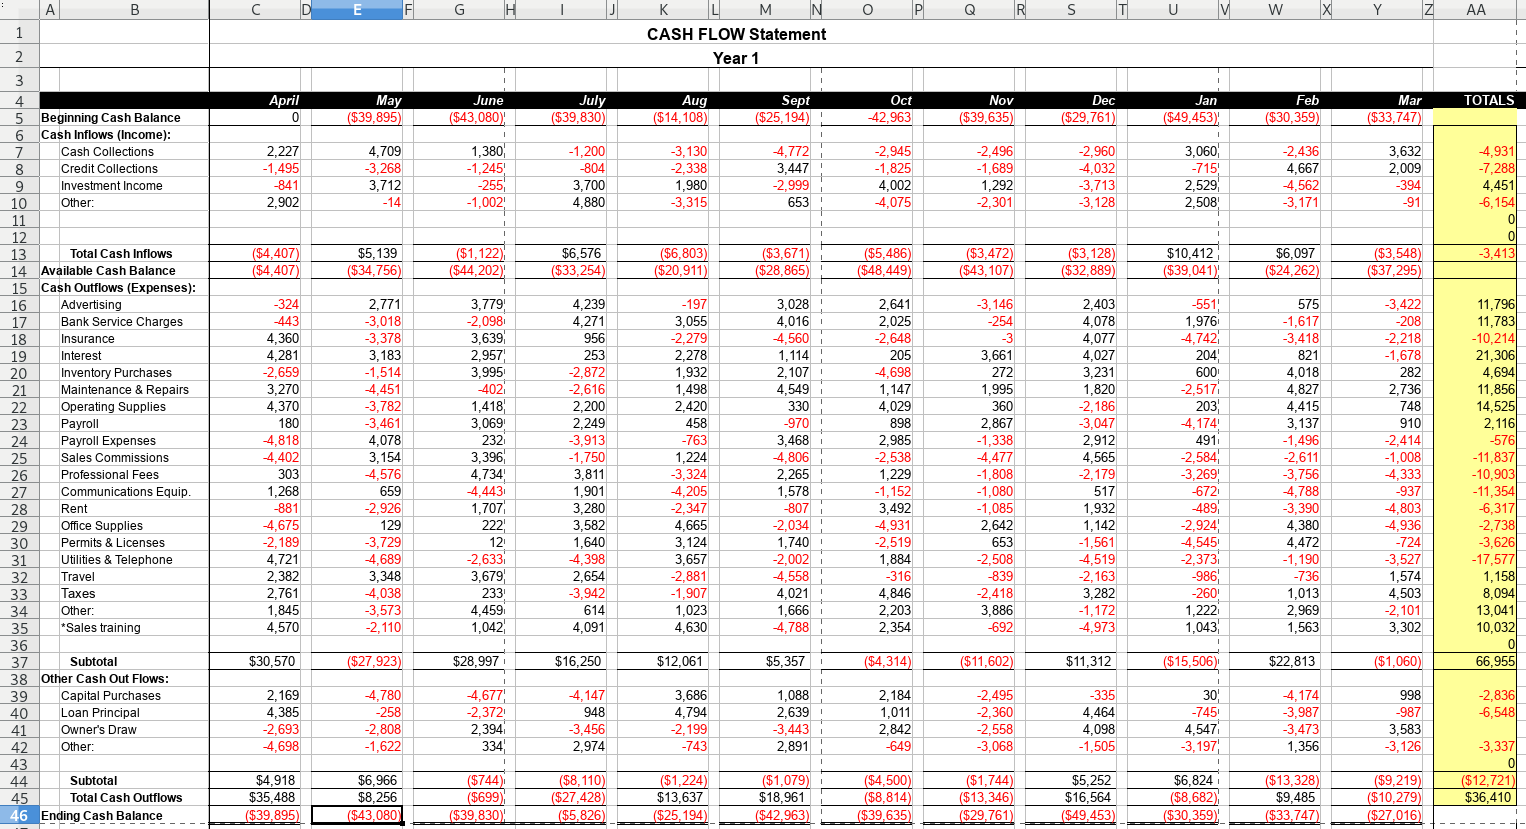
Download the file. Original source.
The techniques are
- Filter out
TOTALrows - Create an ordered factor of the months, which follow the fiscal year April to
March. This is done using the fact that the months appear in column-order as
well as year-order, so we can sort on
col.
cashflows <-
  xlsx_cells(smungs::cashflows) %>%
  dplyr::filter(!is_blank, row >= 4L) %>%
  select(row, col, data_type, character, numeric) %>%
  behead("up", "month") %>%
  behead("left-up", "main_header") %>%
  behead("left", "sub_header") %>%
  dplyr::filter(month != "TOTALS",
                !str_detect(sub_header, "otal")) %>%
  arrange(col) %>%
  mutate(month = factor(month, levels = unique(month), ordered = TRUE),
         sub_header = str_trim(sub_header)) %>%
  select(main_header, sub_header, month, value = numeric)
cashflows
## # A tibble: 336 x 4
## main_header sub_header month value
## <chr> <chr> <ord> <dbl>
## 1 Cash Inflows (Income): Cash Collections April 2227
## 2 Cash Inflows (Income): Credit Collections April -4712
## 3 Cash Inflows (Income): Investment Income April -2412
## 4 Cash Inflows (Income): Other: April 490
## 5 Cash Outflows (Expenses): Advertising April -324
## 6 Cash Outflows (Expenses): Bank Service Charges April 3221
## 7 Cash Outflows (Expenses): Insurance April 960
## 8 Cash Outflows (Expenses): Interest April 936
## 9 Cash Outflows (Expenses): Inventory Purchases April 2522
## 10 Cash Outflows (Expenses): Maintenance & Repairs April 3883
## # … with 326 more rowsTo prove that the data is correct, we can reproduce the total row at the bottom (‘Ending Cash Balance’).
cashflows %>%
  group_by(main_header, month) %>%
  summarise(value = sum(value)) %>%
  arrange(month, main_header) %>%
  dplyr::filter(str_detect(main_header, "ows")) %>%
  mutate(value = if_else(str_detect(main_header, "Income"), value, -value)) %>%
  group_by(month) %>%
  summarise(value = sum(value)) %>%
  mutate(value = cumsum(value))
## `summarise()` regrouping by 'main_header' (override with `.groups` argument)## `summarise()` ungrouping (override with `.groups` argument)## # A tibble: 12 x 2
## month value
## * <ord> <dbl>
## 1 April -39895
## 2 May -43080
## 3 June -39830
## 4 July -14108
## 5 Aug -25194
## 6 Sept -42963
## 7 Oct -39635
## 8 Nov -29761
## 9 Dec -49453
## 10 Jan -30359
## 11 Feb -33747
## 12 Mar -27016