2.3 Meaningfully formatted rows
As with clean, tidy tables, but with a second step to interpret the formatting.
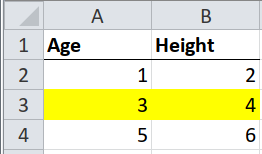
Sometimes whole rows in a table are highlighted by formatting them with, say, a bright yellow fill. The highlighting could mean “this observation should be ignored”, or “this product is no longer available”. Different colours could mean different levels of a hierarchy, e.g. green for “pass” and red for “fail”.
There are three steps to interpreting this.
- Import the table, taking only the cell values and ignoring the formatting.
- Import one column of the table, taking only the formatting and not the cell values.
- Use
dplyr::bind_cols()to append the column of formatting to the table of cell values. You can then interpret the formatting however you like.
Step 1 is the same as clean, tidy tables.
Step 2 uses tidyxl::xlsx_cells() to load the data, tidyxl::xlsx_formats(),
and several tidyverse functions to link the two and filter for only one column.
Why only one column? Because if a whole row is highlighted, then you only need
to know the highlighting of one column to know the highlighting of all the
others.
This is a special case of the following section, meaningfully formatted
cells. Here dplyr::bind_cols() can be used as a
shortcut, because we are joining exactly n rows of formatting to n rows of
data. The following sections is a more general case that can be used instead of
this procedure.
# Step 1: import the table taking only cell values and ignoring the formatting
path <- system.file("extdata", "worked-examples.xlsx", package = "unpivotr")
x <- read_excel(path, sheet = "highlights")

# Step 2: import one column of the table, taking only the formatting and not the
# cell values

# `formats` is a pallette of fill colours that can be indexed by the
# `local_format_id` of a given cell to get the fill colour of that cell
fill_colours <- xlsx_formats(path)$local$fill$patternFill$fgColor$rgb

# Import all the cells, filter out the header row, filter for the first column,
# and create a new column `fill_colour` of the fill colours, by looking up the
# local_format_id of each cell in the `fill_colours` pallette.
fills <-
  xlsx_cells(path, sheet = "highlights") %>%
  dplyr::filter(row >= 2, col == 1) %>% # Omit the header row
  mutate(fill_colour = fill_colours[local_format_id]) %>%
  select(fill_colour)

# Step 3: append the `fill` column to the rest of the data
bind_cols(x, fills) %>%
  select(Age, Height, fill_colour)
## # A tibble: 3 x 3
## Age Height fill_colour
## <dbl> <dbl> <chr>
## 1 1 2 <NA>
## 2 3 4 FFFFFF00
## 3 5 6 <NA>Note that the fill colour is expressed as an RGB value with transparency in the
first two letters, e.g. FFFFFF00 is FF (opaque), with FFFF00 (yellow).
Here’s another way using only tidyxl and unpivotr.
fill_colours <- xlsx_formats(path)$local$fill$patternFill$fgColor$rgb

xlsx_cells(path, sheet = "highlights") %>%
  mutate(fill_colour = fill_colours[local_format_id]) %>%
  select(row, col, data_type, character, numeric, fill_colour) %>%
  behead("up", header) %>%
  select(-col, -character) %>%
  spatter(header) %>%
  select(-row)
## # A tibble: 3 x 3
## fill_colour Age Height
## <chr> <dbl> <dbl>
## 1 <NA> 1 2
## 2 FFFFFF00 3 4
## 3 <NA> 5 6